South Africa vs Nigeria: Which Country Has the Most Efficient Crypto Market?
Africa's two largest crypto markets — South Africa and Nigeria — have very different market structures. Using 90 days of cross-exchange data from 7 sources, we measure which market prices crypto assets more efficiently.
Measuring Market Efficiency
We define efficiency as how closely exchange prices track the global reference rate. The global reference is a synthetic cross-rate computed as CRYPTO/USDT × USD/FIAT using Binance spot prices and institutional FX rates.
A lower divergence = more efficient market. Higher divergence indicates friction — capital controls, limited competition, or liquidity gaps.
The Results (90-day average)
Crypto Assets (BTC, ETH, XRP)
| Pair | Avg Divergence | Std Deviation | Verdict |
|---|---|---|---|
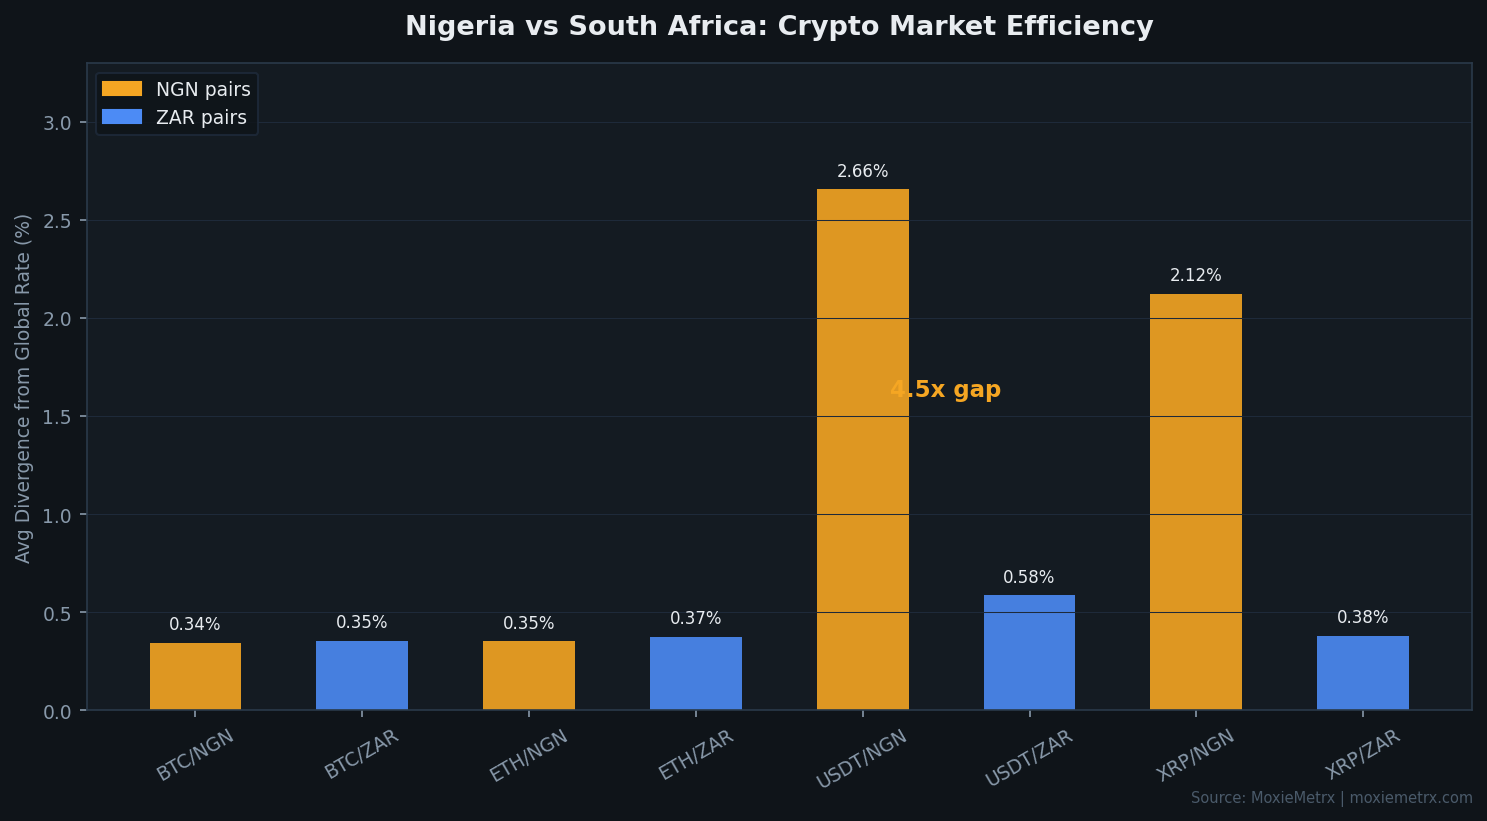
| BTC/NGN | 0.343% | 0.326 | Efficient |
| BTC/ZAR | 0.354% | 0.751 | Efficient but more volatile |
| ETH/NGN | 0.350% | 0.319 | Efficient |
| ETH/ZAR | 0.373% | 0.670 | Efficient but more volatile |
| XRP/NGN | 2.123% | 2.319 | Inefficient |
| XRP/ZAR | 0.377% | 0.844 | Efficient |
Surprise: Nigeria's BTC and ETH markets are as efficient as South Africa's. BTC/NGN diverges just 0.34% from the global rate — almost identical to BTC/ZAR at 0.35%. This challenges the narrative that Nigerian crypto markets are wildly mispriced.
The exception is XRP/NGN at 2.1% divergence — driven by a thin Luno order book for XRP in naira, where stale limit orders create artificial spreads up to 20%.
Stablecoins (USDT, USDC) — Where the Real Difference Is
| Pair | Avg Divergence | Std Deviation |
|---|---|---|
| USDT/NGN | 2.656% | 1.381 |
| USDT/ZAR | 0.585% | 0.696 |
The stablecoin market tells a completely different story. USDT/NGN trades at 2.66% above the global rate — 4.5x the ZAR premium. This gap isn't about crypto; it's about foreign exchange access.
USDT serves as a dollar proxy in Nigeria. The premium reflects the cost of accessing USD through crypto channels versus the official CBN rate. South Africa's more open capital account means USDT/ZAR tracks the global rate much more closely.
What Drives the Difference?
South Africa: Open capital account, multiple exchanges
South Africa has 4 active crypto exchanges competing on ZAR pairs (Luno, VALR, AltCoinTrader, Ovex). The tight spreads reflect:
- Free capital movement — no restrictions on buying/selling USD (South African Reserve Bank Exchange Control Manual)
- Multiple market makers — 4 exchanges with active order books
- Institutional participation — VALR is registered as a CASP under the Financial Sector Conduct Authority (FSCA, 2023)
Nigeria: Capital controls create a stablecoin premium
Nigeria's efficient BTC/ETH pricing alongside its high USDT premium reveals a nuanced market:
- BTC/ETH price discovery works — multiple exchanges (Luno, Quidax, Busha, Ovex) compete effectively on crypto pricing
- USDT premium = FX premium — the 2.66% gap is the cost of the parallel market for dollar access (CBN Exchange Rate Policy, 2024)
- Regulatory uncertainty — the CBN's 2021 banking ban on crypto (partially relaxed in December 2023) created structural friction (SEC Nigeria Virtual Assets Framework, 2024)
Cross-Exchange Spreads Tell the Story
The daily spread between the cheapest and most expensive exchange for each pair:
| Pair | Avg Daily Spread | Interpretation |
|---|---|---|
| BTC/NGN | 3.5% | 4 exchanges competing, but Busha consistently prices 2% lower |
| BTC/ZAR | 1.5% | Tightest spreads — most competitive market |
| XRP/NGN | 15% | Luno has stale limit orders — illiquid market, not real arbitrage |
| ETH/ZAR | 3-5% | AltCoinTrader often 2-3% above VALR |
Implications
- Nigeria's crypto market is more efficient than its reputation suggests. BTC/NGN tracks global rates within 0.34% — comparable to South Africa.
- The real story is in stablecoins. USDT/NGN's 2.66% premium is a direct measure of Nigeria's FX market friction. Watch this number — when it narrows, it signals improving dollar access.
- Single-exchange pricing is unreliable for both countries. Cross-exchange spreads of 1.5-15% mean any NAV calculation, tax valuation, or portfolio report using a single source could be materially wrong.
- South Africa is the benchmark. ZAR pairs have the tightest spreads and lowest premiums in Africa. Use them as your baseline for what an efficient African crypto market looks like.
Methodology
Data: 90 days (January - April 2026), ~25,000 data points per pair. Sources: Luno, Quidax, VALR, Ovex, Busha, AltCoinTrader, Binance (synthetic baseline). Divergence = |VWAP - Synthetic| / VWAP × 100. VWAP computed across all active exchanges per pair, excluding synthetic.
Get this data via API: docs.moxiemetrx.com. Free tier — 5,000 requests/month, no credit card.
References
- South African Reserve Bank. "Exchange Control Manual." resbank.co.za
- Financial Sector Conduct Authority. "Crypto Asset Service Providers." fsca.co.za
- Central Bank of Nigeria. "Exchange Rate Policy." cbn.gov.ng
- Securities and Exchange Commission Nigeria. "Rules on Virtual Assets Service Providers." sec.gov.ng
- Chainalysis. (2023). "The 2023 Geography of Cryptocurrency Report." chainalysis.com