Why Single-Exchange Pricing Costs You Money
If you are building a fintech product that touches crypto in Africa, the exchange rate you display to your users is only as good as its source. Most teams start with a single exchange API. It is fast, simple, and wrong — often by several percent. We measured exactly how wrong.
The Data
All figures in this analysis are computed from live exchange data aggregated by moxiemetrx across Luno, Quidax, VALR, Ovex, Busha, AltCoinTrader, and Binance. For each 5-minute candle we compute three prices — the single highest-volume exchange, a 2-source volume-weighted average (VWAP), and a 3-source VWAP — and compare each to an independent synthetic benchmark (CRYPTO/USDT × USD/FIAT from Binance spot and the ExchangeRate-API institutional FX feed).
Measurement window: 2026-04-03 → 2026-04-20, the 18 days of overlapping coverage where every pair has at least three simultaneous live exchange sources. Using a matched window avoids mixing Luno's full 12-month history with Busha/Ovex/AltCoinTrader, which onboarded on 2026-04-03.
Key findings
| Metric | Value |
|---|---|
| Max single-source divergence (USDT/KES) | 8.72% |
| Min 3-source VWAP divergence (BTC/KES) | 0.90% |
| Median improvement, 1 → 3 sources, across 5 pairs | 52% |
| Pairs measured | 5 (BTCNGN, XRPNGN, BTCKES, USDTKES, ETHZAR) |
| Candles sampled per pair | 4,226 – 5,077 |
The Problem: Fragmented Liquidity
African crypto markets are structurally different from developed markets. Liquidity is spread thin across dozens of exchanges, each with different order books, fee structures, and user bases. A price on Luno may differ meaningfully from a price on Quidax, which differs again from Ovex or Busha.
This is not a bug; it is the natural consequence of fragmented capital controls, varying KYC regimes, and limited market-making infrastructure. Chainalysis documented this fragmentation in their 2023 Geography of Cryptocurrency Report, noting that African exchanges operate with significantly less depth than their global counterparts.
The consequence for anyone consuming a single price feed: you are getting one exchange's view of a market that has no single canonical price.
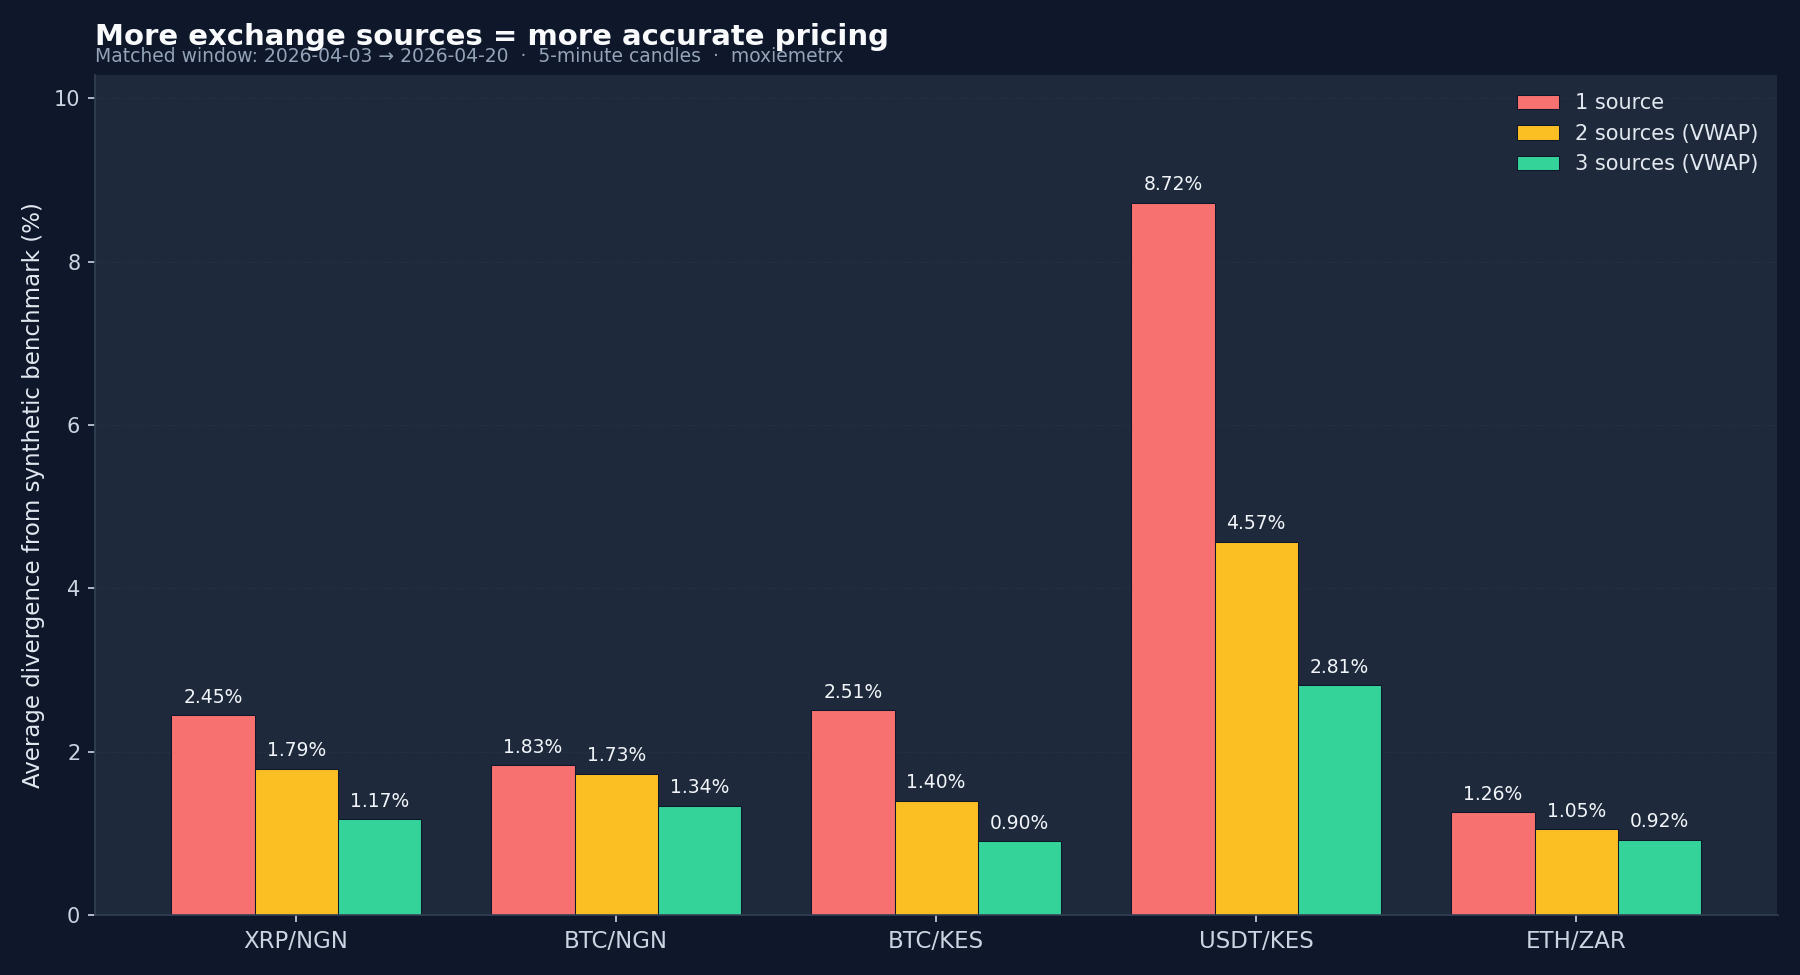
How Many Sources Actually Matter
Divergence is the absolute percentage gap between the computed price and the synthetic benchmark, averaged across every 5-minute candle in the measurement window.
XRP/NGN (Nigeria)
| Sources | Exchange(s) used | Avg divergence |
|---|---|---|
| 1 | Luno | 2.45% |
| 2 | Luno + Quidax | 1.79% |
| 3 | Luno + Quidax + Busha | 1.17% |
A single naira price for XRP is off by nearly 2.5% on average. Adding two more sources cuts that divergence by more than half.
What That Costs in Real Money
Before moving to the other pairs, it is worth pausing on what a 2.45% single-source error is actually worth:
| Position size | Max error (single source) | Error with 3-source VWAP |
|---|---|---|
| $10,000 | $245 | $117 |
| $100,000 | $2,450 | $1,170 |
| $1,000,000 | $24,500 | $11,700 |
For remittance platforms processing millions in monthly volume, for lending protocols marking collateral to market, for accounting teams reporting in local currency — this is not a rounding error. It is a material misstatement.
BTC/KES (Kenya)
| Sources | Exchange(s) used | Avg divergence |
|---|---|---|
| 1 | Luno | 2.51% |
| 2 | Luno + Busha | 1.40% |
| 3 | Luno + Busha + Ovex | 0.90% |
USDT/KES
| Sources | Exchange(s) used | Avg divergence |
|---|---|---|
| 1 | Luno | 8.72% |
| 2 | Luno + Busha | 4.57% |
| 3 | Luno + Busha + Ovex | 2.81% |
USDT/KES is the most extreme case in our dataset. A single Kenyan shilling price for tether sits more than 8% away from the synthetic USD/KES benchmark on average, because one exchange's order book alone does not reflect the parallel-market premium that USDT carries as a dollar proxy. Three-source aggregation cuts the error by a factor of three.
ETH/ZAR (South Africa)
| Sources | Exchange(s) used | Avg divergence |
|---|---|---|
| 1 | VALR | 1.26% |
| 2 | VALR + Luno | 1.05% |
| 3 | VALR + Luno + Ovex | 0.92% |
South African pairs benefit less from aggregation because VALR is already the deepest ZAR book. This is the product argument for VWAP over naive averaging — adding a thinly-traded venue to a high-volume one should not pull the price toward the low-volume quote, and VWAP's volume weighting prevents exactly that.
BTC/NGN
| Sources | Exchange(s) used | Avg divergence |
|---|---|---|
| 1 | Luno | 1.83% |
| 2 | Luno + Quidax | 1.73% |
| 3 | Luno + Quidax + Busha | 1.34% |
Source Quality Is Half the Story
Adding sources only helps when the added sources have competent pricing. When we compute divergence on the longer (asymmetric) 12-month window for ETH/ZAR — which is dominated by Luno — the single-source number drops to 0.41% because Luno-ETHZAR has been stable and liquid for a year. The matched-window 1.26% number is higher precisely because it includes the more volatile April-2026 period during which new exchanges onboarded and VALR became the primary volume venue.
This is why moxiemetrx uses volume-weighted averaging across sources rather than simple means, and why every rate is returned to API consumers with a verification status (verified / caution / unverified) and a confidence score.
Cross-Exchange Spread: What a Single Price Hides
Divergence from a synthetic benchmark is one way to measure single-source error. The other is to look at how far apart exchanges actually are from each other on any given day. The numbers below use a rolling 10-day window to show current market conditions rather than the matched 18-day window from the divergence analysis above.
BTC/NGN, 10 days ending 2026-04-21, across Luno, Quidax, Busha, and Ovex:
| Metric | Value |
|---|---|
| Days sampled | 10 |
| Average daily spread | 2.78% |
| Minimum daily spread | 2.59% (2026-04-19) |
| Maximum daily spread | 2.93% (2026-04-15) |
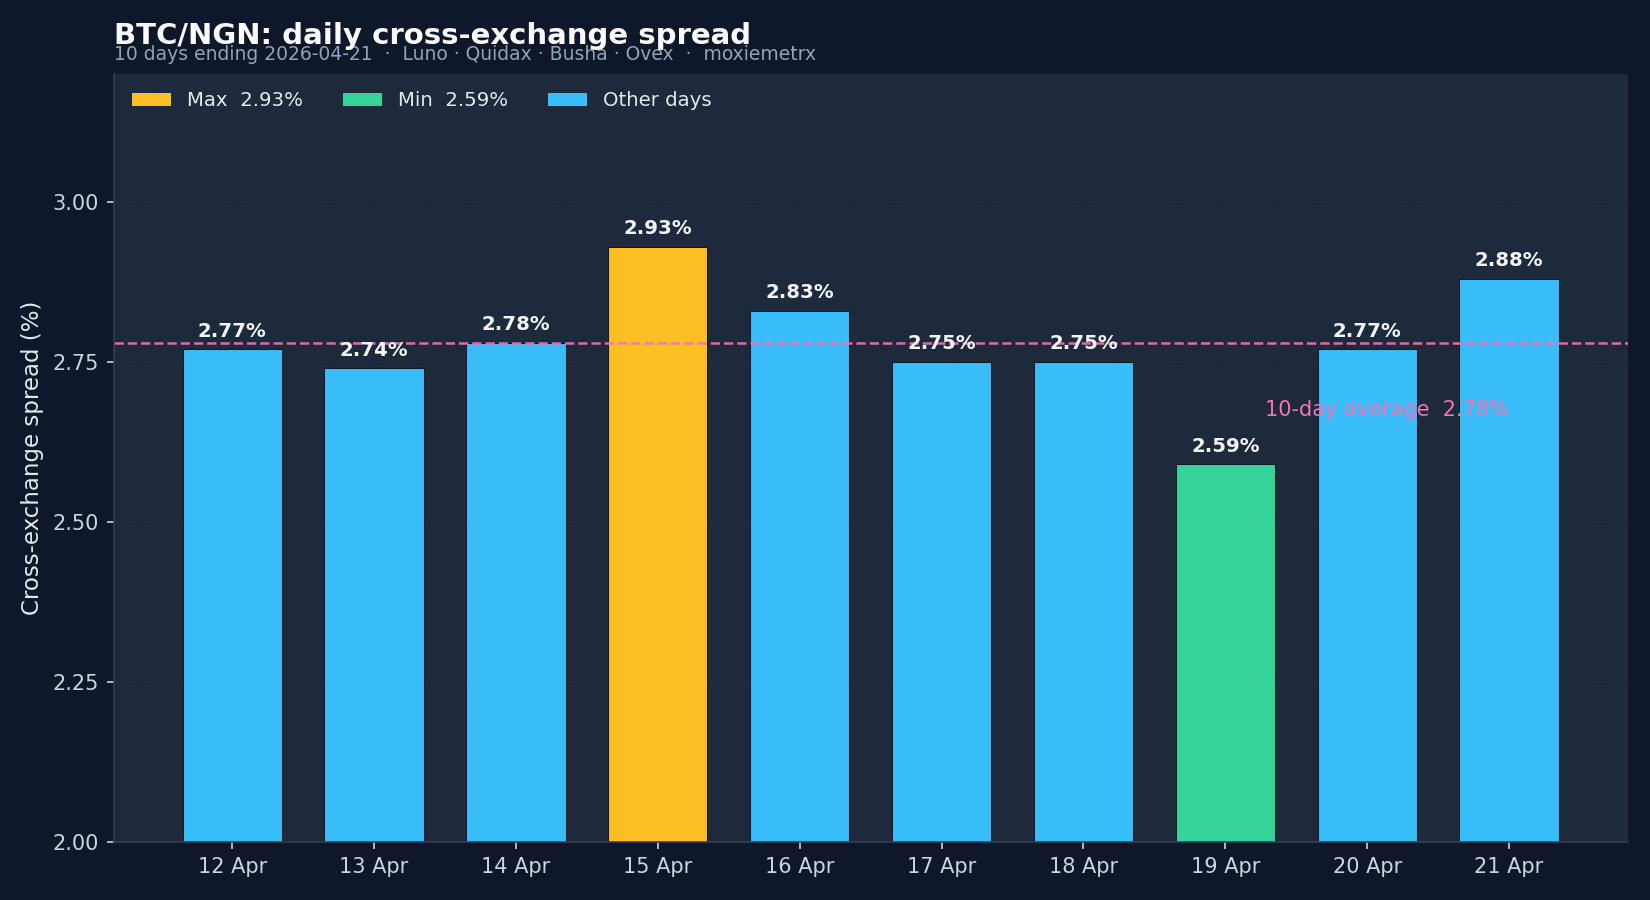
On the worst day in the window — 2026-04-15 — the cheapest and most expensive Nigerian exchanges for bitcoin were 2.93% apart. A $100,000 BTC/NGN position valued off one exchange versus the other would have differed by $2,930.
The Premium Regime Shifted in April 2026
The signed premium (exchange VWAP minus synthetic) for BTC/NGN was slightly negative and stable — roughly −0.1% — for eleven of the last twelve months. In April 2026 it flipped to +1.30% as Busha and Ovex lifted the VWAP above the synthetic.
| Month | Avg signed premium | Avg abs divergence | 5m candles |
|---|---|---|---|
| 2025-11 | −0.09% | 0.25% | 8,640 |
| 2025-12 | −0.11% | 0.20% | 8,928 |
| 2026-01 | −0.14% | 0.22% | 8,928 |
| 2026-02 | −0.18% | 0.37% | 8,064 |
| 2026-03 | −0.18% | 0.36% | 8,672 |
| 2026-04 | +1.30% | 1.30% | 5,760 |
Anyone relying on a single exchange feed — or on an aggregator that had not yet integrated the new venues — would have missed the regime change entirely, carrying 2025 mental models into a market that has already moved.
Why VWAP, Not Simple Averages
A naive mean across exchanges treats a thinly traded venue the same as a high-volume one. Volume-weighted average price gives more weight to exchanges where actual trading activity is concentrated, so a stale ticker on a low-volume book cannot pull the headline rate.
Both the CFA Institute's guidance on Fair Value Measurement and IFRS 13 emphasize the same principle: fair value estimates should prioritize observable market data from multiple independent sources, with higher weight given to more active markets.
See it live: Cross-Exchange Arbitrage Scanner — real-time spreads across 7 African exchanges for every pair.
Practical Recommendations
For payment and remittance platforms. Never display or settle on a rate from a single exchange. Aggregate at least three sources with VWAP. The cost of two extra API calls is negligible compared to the pricing risk — especially on USDT pairs, where single-source error can exceed 8%.
For lending and DeFi protocols. Collateral valuation using a single feed creates exploitable arbitrage. In a market where exchanges have sat consistently 2.6–2.9% apart over the last ten days, a liquidation bot with a better price feed has a risk-free edge against a protocol that relies on one exchange. Multi-source aggregation narrows the window for liquidation manipulation.
For compliance and reporting teams. If your auditor asks how you determined a crypto-fiat rate, IFRS 13 expects you to use the best available market data, which in fragmented markets means aggregation. A single exchange does not meet that standard.
Methodology
Divergence = |P_n − S| / S × 100, where P_n is the price computed from the top-n highest-volume exchanges (VWAP-weighted for n ≥ 2) and S is the synthetic cross-rate benchmark for the same 5-minute timestamp. Quote-volume is used as the weighting variable where reported; where an exchange reports zero quote volume (Busha, Ovex, AltCoinTrader, VALR during the measurement window), the mean close is used as a fallback and the exchange is counted but not down-weighted.
Measurement window: 2026-04-03 → 2026-04-20 (matched — all pairs have ≥3 live sources). Per-pair candle counts range from 4,226 (BTCKES) to 5,077 (BTCNGN). Synthetic benchmark coverage is 99.7 – 100% of the theoretical 5-minute candle count, i.e. no benchmark gaps. Rows with exchange = 'synthetic' or exchange = 'binance_usdt' are excluded from the real-exchange set.
Full SQL and replication data are available on request.
Get this data via API: moxiemetrx.com/signup. Free tier — 5,000 requests per month, no credit card required.
References
- Chainalysis. (2023). "The 2023 Geography of Cryptocurrency Report." chainalysis.com
- International Financial Reporting Standards Foundation. "IFRS 13: Fair Value Measurement." ifrs.org
- CFA Institute. "Guidance Statement on Fair Value Measurement." CFA Institute Standards of Practice. cfainstitute.org
- Ozili, P.K. (2022). "Decentralised Finance and Cryptocurrency Activity in Africa." In The New Digital Era: Digitalisation, Emerging Risks and Opportunities, Emerald Publishing. doi.org/10.1108/S1569-37592022000109A001